This project began life way back before I discovered the Raspberry Pi with the PICAXE microcontoller and the commonly used DS18B20 1-wire digital temperature thermometer (top-right).
Fast forward to 2017 and I helped my daughter build an Air Quality School Science project using a Raspberry Pi Zero.
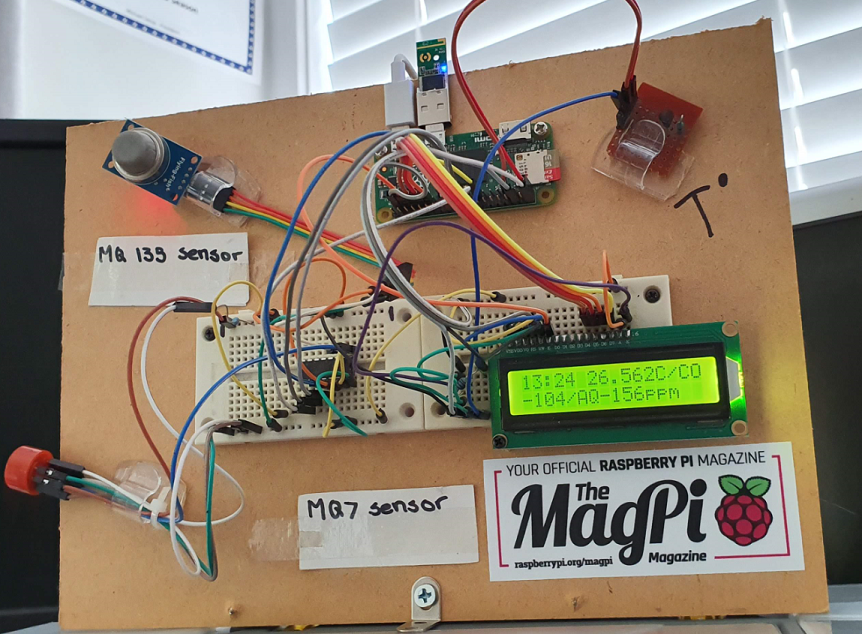
To do this, we added a couple of simple-to-use sensors, the MQ7, which measures carbon monoxide and the MQ135 Air Quality sensor. To convert the data we used a MCP3008 analog-to-digital converter (ADC) mounted on a breadboard. There are plenty of examples around the web about how to do this but I found this one pretty helpful.
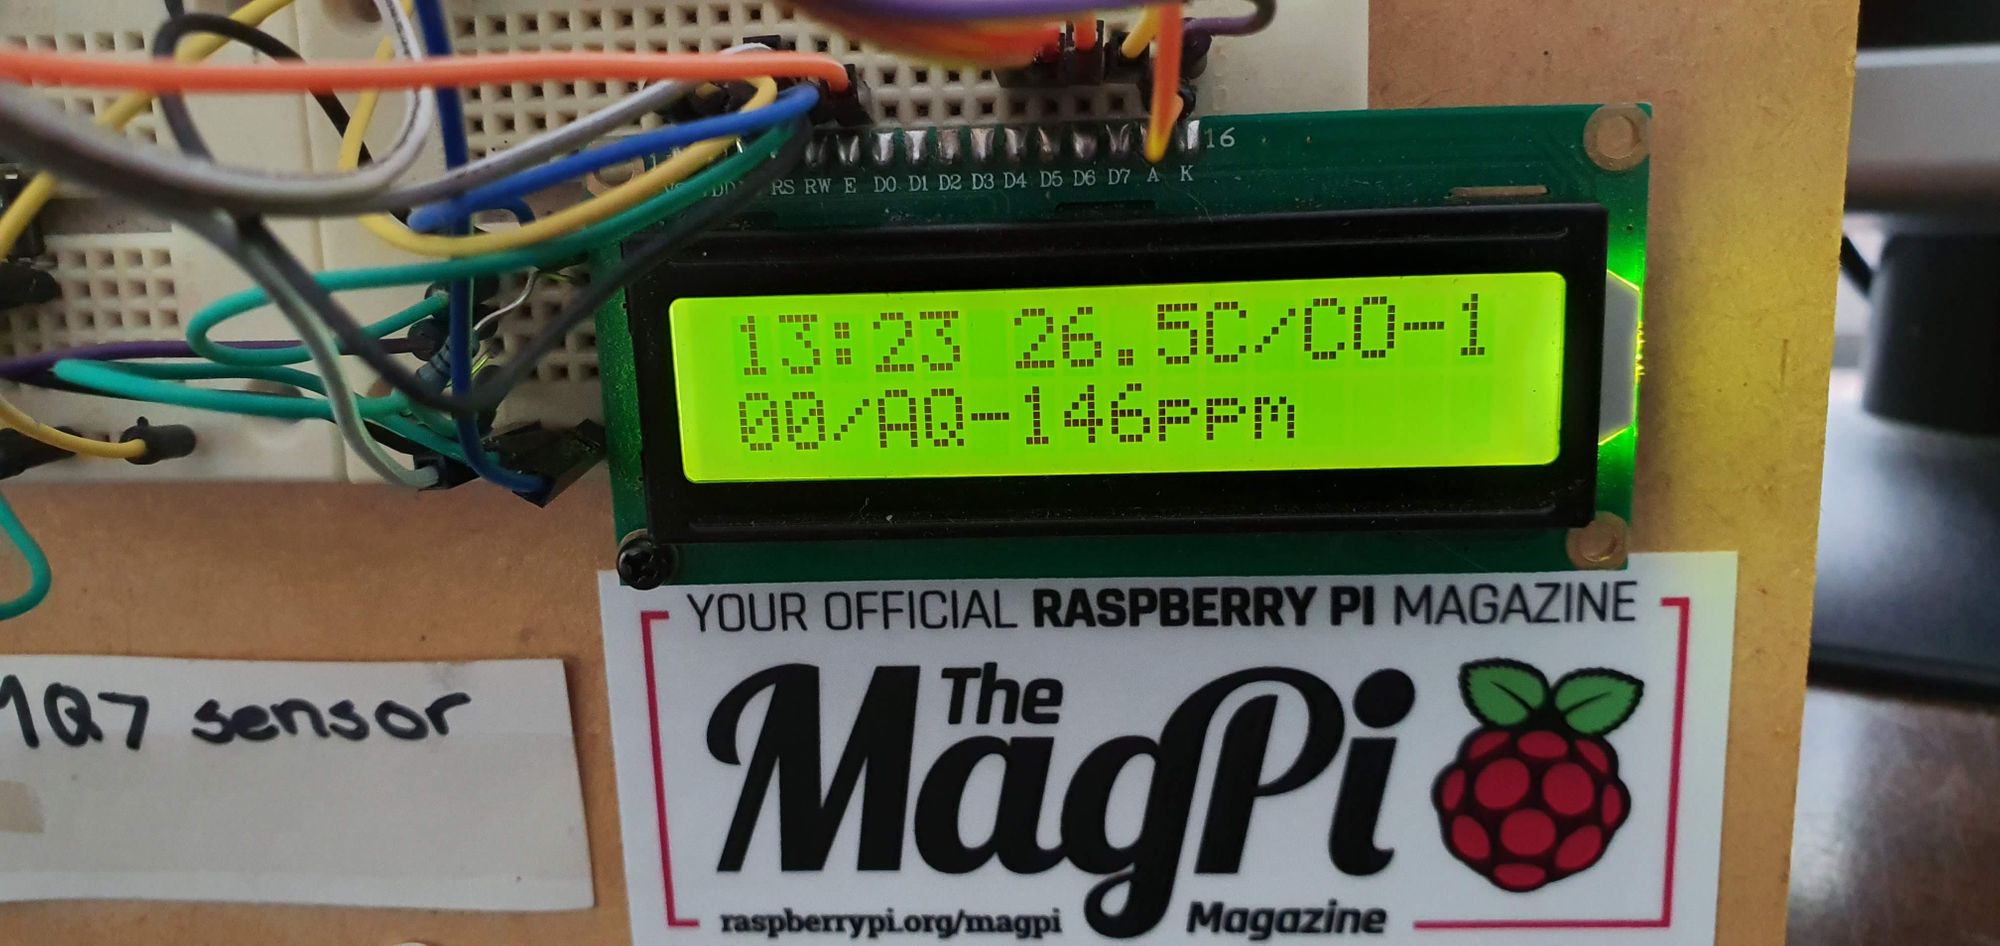
After the science fair, the project gathered dust for many months before I added the 16x2 LCD screen and created the python code to read the sensor data and display it on the screen.
Over the summer, I created a DynamoDB table on Amazon Web Services and modified the code to send the sensor readings every couple of minutes. DynamoDB is great for IoT projects and with the AWS Free Tier, there is no cost for the first 25GB.
Next I created a simple web page to display the results. With everything now working, I mounted the completed circut and left it to capture and record data.
Then over the New Year period, Australia was devasted by it's worst bush fires in years.  Within a couple of days, the smoke from the fires drifted across the Tasman sea, casting an eerie, orange haze over Auckland and parts of the North Island.
A few days later, I checked the graph and was suitably impressed to observe that with a Pi and a simple sensor, I was able to capture the spike in air pollution from the smoke.

With this project, I have explored different aspects and applications of the Raspberry Pi. From sensor reading with the GPIO pins, to hooking up an LCD and intergrating with AWS DynamoDB for an IoT project. I've learnt a lot along the way and I hope you've enjoyed the read.